Soils and experimental set up:
The study was conducted on two soils: an Orthic Gray Luvisol (Typic Cryoboralf) of the Breton (Figure2) loam series located in the rolling landscape of the vicinity of Breton, Alberta, and an Orthic Black Chernozem (Typic Cryoboroll) of the Malmo loam series common to the flat lacustrine landscape near Ellerslie (Figure1), Alberta. These two soils are only ~70 km apart and represent two major and distinctly different soil types found in north-central Alberta. Descriptive data of both soil types are given in Table1 (Plante et al. 2010).
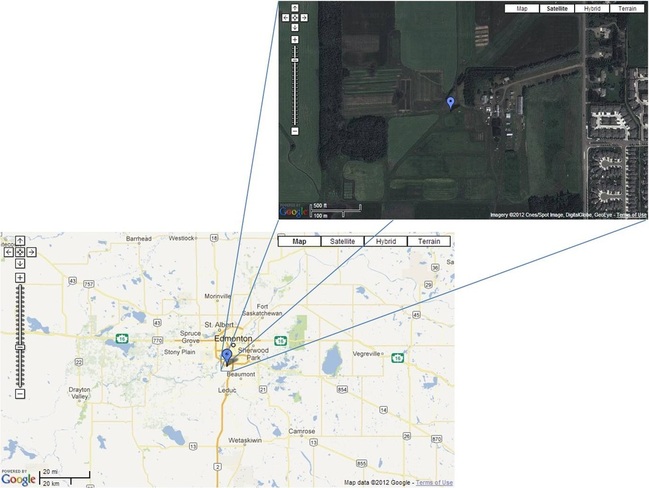
Figure 1: Ellerslie research Site
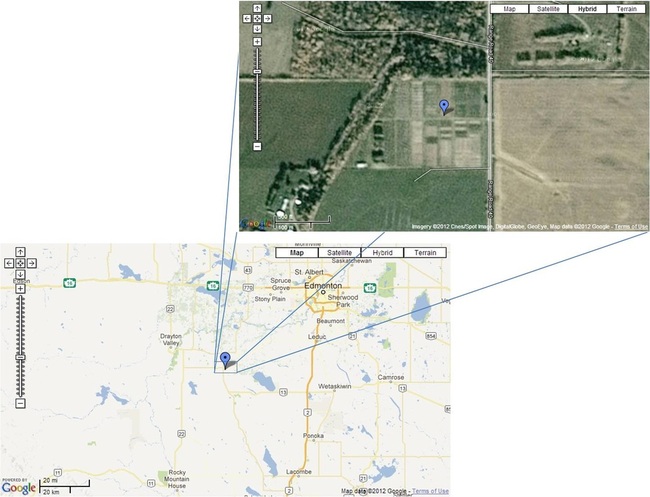
Figure 2: Breton Research Site
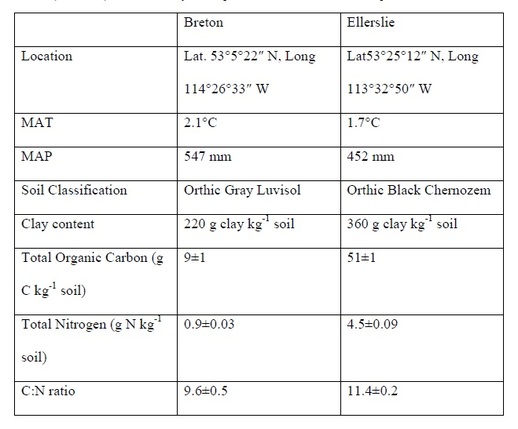
Table1: Descriptive Characteristics of surface soils
Parallel long-term experiments were established at each site in 1979 (Nyborg et al. 1995) and consist of 1 control (non-tilled/unfertilized) and 3 treatments randomized in 4 blocks for a total of 16 plots. The dimension of each small plot is 6.85 m x 6.85 m. For this investigation the tillage reversal was expressed as pre-seeding tillage. Tillage reversal after ~30 years (1979 to 2009) was done by using rototiller up to 5 cm depth to mimic “one-off” tillage event by the farmer for weed controls, crop failures etc.
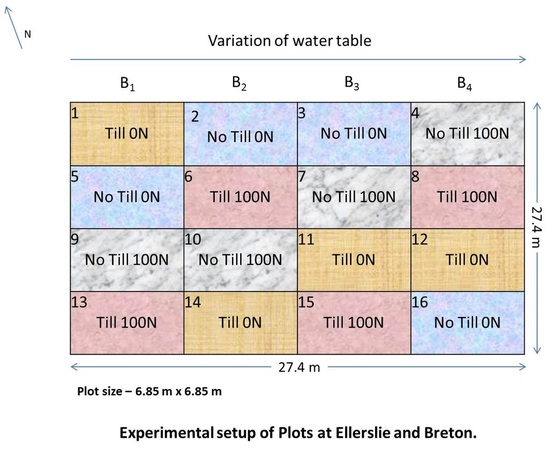
Table 2: Experimental design
NOTE: No Till 0N is considered control
NOTE: No Till 0N is considered control
Parameters and variables:
The purpose of this study was to quantify CO2 flux under two different tillage managements in different soils when they were both fertilized and unfertilized. Hence, the response variable simply was the gas flux and predictor variables were two tillage regimes, fertilized and unfertilized, and also the soil type (location) along with date (month).
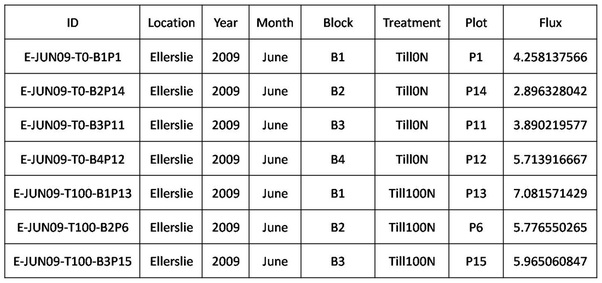
Table 3: Sample dataset
Gas flux measurements
A non-steady state chamber system, described in details by Rochette and Bertrand (2008) was used to measure soil CO2 fluxes. The chambers (Figure 3) were rectangular (65 cm x 16cm x 15cm) each of which consisted of a detachable chamber lids and collar. The whole chamber system except the bottom 5 cm of the collar was made opaque by wrapping it with bubbled aluminum foil and / or reflective tape so as to prevent penetration of sunlight during chamber deployment. The collars were inserted 5 cm into the ground leaving 10 cm above ground. The collars were kept inserted into the ground on each of the plots throughout the growing season. The chamber lid was attached to the collar with four rubber bands during gas flux measurements. A small fan operated with a battery was mounted under the chamber lid to maintain continuous air mixing inside the chamber between gas concentration measurements. Gas concentrations were monitored by portable, photoacoustic multi-gas monitor (Innova model 1312; www.innova.dk) (Figure 4) which was connected to the chambers by 2 m long plastic tubing during flux measurements. Carbon dioxide (CO2), nitrous oxide (N2O) and water vapor (H2O(v)) were measured by the gas monitor. The instrument is calibrated on an annual basis such that interference between CO2, N2O and H2O(v) and ambient temperature are compensated for. The gas analyzer was transported from chamber to chamber in a wagon. During a concentration measurement, the gas analyzer was connected to the chamber with the plastic tubing for a 1 minute period. The gases in the chamber head space were circulated within the chamber and the gas analyzer. The digital reading of the gas (CO2) concentration inside the chamber was recorded from the gas analyzer. The whole chamber deployment procedure like chamber selection, timing of opening and closing of lids, activation of gas analyzer and fans was operated manually. Gas fluxes were measured in sets of 4 chambers by staggering the lid attachment to the collars and gas concentration measurement in the chambers (2 minutes apart). Gas concentrations were measured at 0, 10, 20 and 30 minutes after the lid was placed on the collar. CO2 flux measurements were carried out once a week throughout the growing season on each of the experimental sites (at Ellerslie and Breton) in 2010 and at Ellerslie in 2009. The gas flux was then calculated using the rate of change of its concentration with respect to time (dG/dt) inside the chamber during deployment (Rochette and Hutchinson 2005):
F = (dG/dt) * V/A
Where, F = Gas flux (mg m-2 min-1), dG/dt = change in gas concentration with time (mg m-3 min-1), V = volume of chambers (m3), A = area covered by chambers (m2).
F = (dG/dt) * V/A
Where, F = Gas flux (mg m-2 min-1), dG/dt = change in gas concentration with time (mg m-3 min-1), V = volume of chambers (m3), A = area covered by chambers (m2).
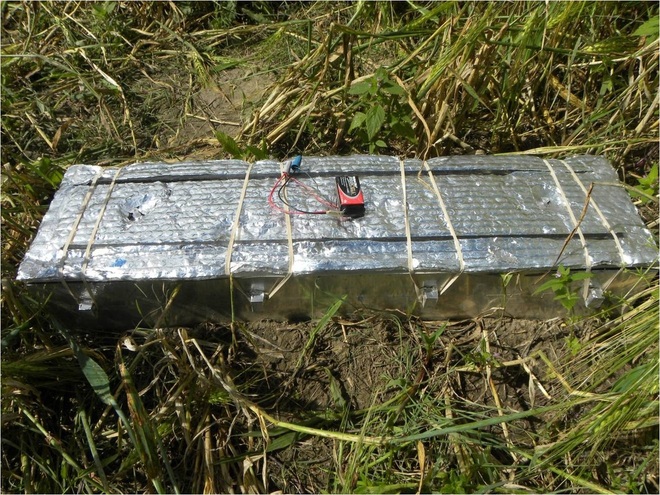
Figure 3: An active chamber in situ
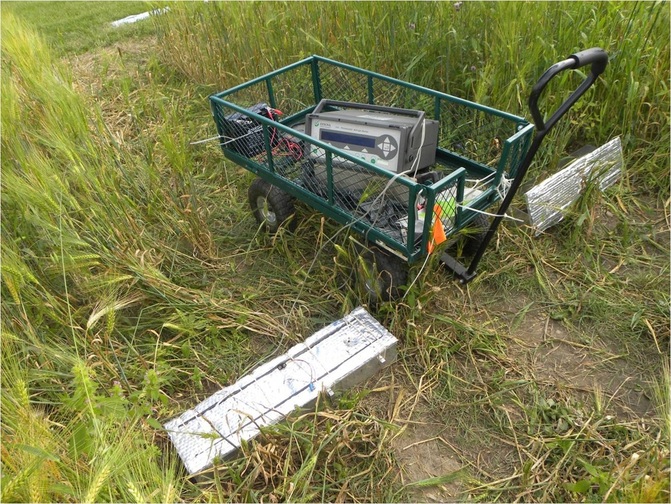
Figure 4: Photoacoustic multi gas analyzer connected to the active chamber
through tubing
through tubing
Disclaimer: All datasets, events and parameters have been manipulated and/or randomly generated.
