Exploring distribution in dataset:
In order to explore the distribution of data, boxplots were used to determine normality, outliers, and comparing class of variables and treatments. As we may see in following figures the distribution of data in different locations are different and there are no outliers in the whole dataset.
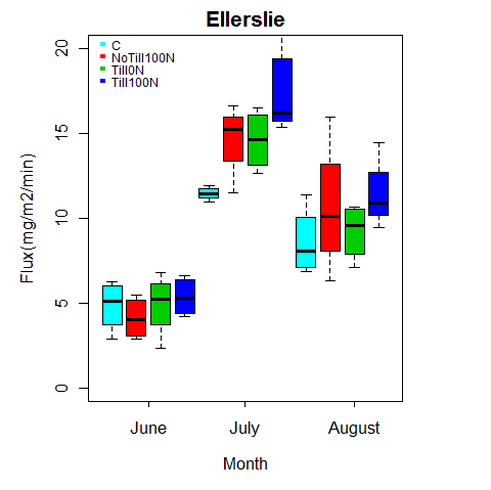
Figure 1: Boxplots of CO2 flux from Ellerslie
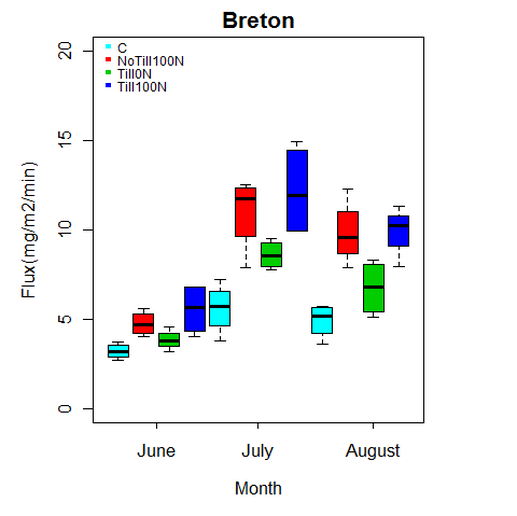
Figure 2: Boxplots of CO2 flux from Breton
Checking ANOVA assumptions:
To check ANOVA assumptions for normality and equality in variance we tried residual plots for both sites. First we generated histogram of residuals and also residual plots then ran the Shapiro test. After testing normality by Shapiro test, Bartlette's test was used for testing of equality of variances. P value from both Shapiro and Bartlette's tests was higher than 0.05 so the assumption of normality and equality of variance wasn't rejected.
In accordance with the results from shapiro and bartlette's test ANOVA assumptions were not violated. So we were allowed to use ANOVA.
In accordance with the results from shapiro and bartlette's test ANOVA assumptions were not violated. So we were allowed to use ANOVA.
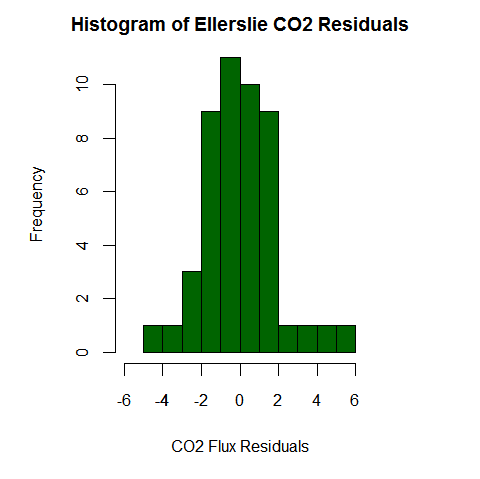
Figure 3: Histogram of residuals (Ellerslie)
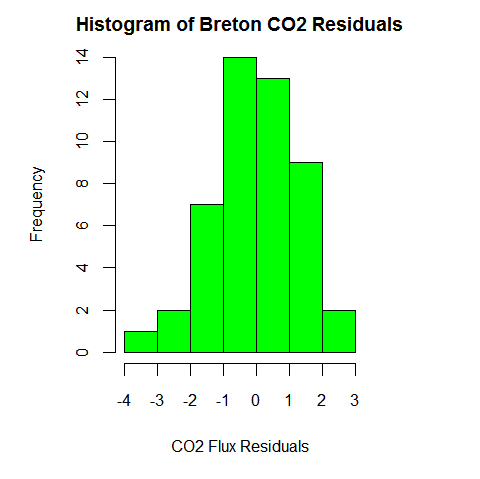
Figure 4: Histogram of residuals (Breton)
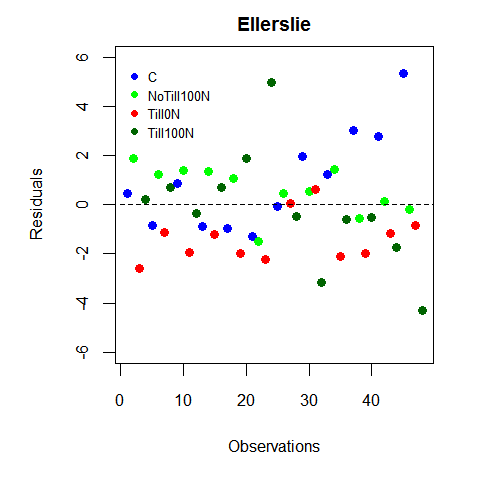
Figure 5: Plot of residuals (Ellerslie)
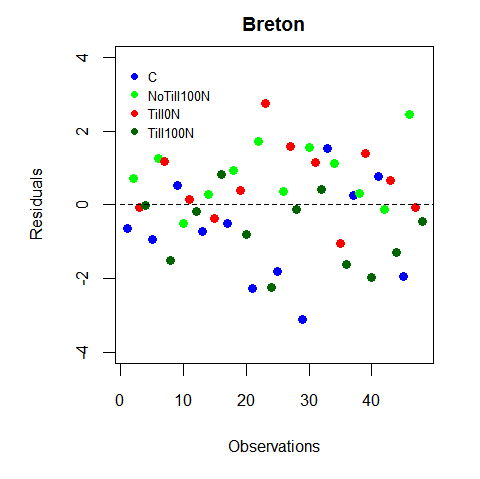
Figure 6: Plot of residuals (Breton)
Shapiro and Bartlette's test results:
Ellerslie:
shapiro.test()
Shapiro-Wilk normality test
W = 0.9712, p-value = 0.2807
bartlett.test()
Bartlett test of homogeneity of variances
Bartlett's K-squared = 1.9834, df = 3, p-value = 0.5759
Breton:
shapiro.test()
Shapiro-Wilk normality test
W = 0.9883, p-value = 0.9107
bartlett.test()
Bartlett test of homogeneity of variances
Bartlett's K-squared = 5.4003, df = 3, p-value = 0.1447
Disclaimer: All datasets, events and parameters have been manipulated and/or randomly generated.
